
· 6 min read
Fibre-based versus resin-coated paper: structure, handling and longevity
How the baryta-and-paper construction of fibre prints differs from the plastic-sealed RC base, and the consequences for washing, drying and archival life.
Written in by Simon Lehmann Editor
A print fails most often not because the negative is bad, but because the negative and the paper are mismatched. Every paper accepts only a limited span of exposure between the lightest tone it can hold and the maximum black it produces; every negative presents a span of densities, from clear shadow areas to dense highlights. When the two line up, the print carries detail across the whole scale. When they do not, shadows block up or highlights wash out. Choosing a contrast grade is the act of bringing them into register, and ISO 6846 gives the arithmetic for doing it on purpose rather than by trial.
A printing paper does not respond to light in a straight line. Below a threshold it records nothing but paper-base white; above a ceiling it records nothing but maximum black; between the two lies the useful exposure scale, measured in log exposure units. ISO 6846:1992 pins that scale to two defined points on the paper’s characteristic curve. The shadow-print end, H_T, is the exposure required to raise the density to 0.04 above base-plus-fog: the first tone that is just perceptibly darker than clear paper. The highlight end, H_S, is the exposure that reaches 0.90 of the net maximum density above base-plus-fog: the deepest black still holding texture rather than going fully solid. The ISO range is then
R = (log₁₀ H_S − log₁₀ H_T) × 100,
so the figure on a datasheet is the log exposure range between those two endpoints, multiplied by 100. The same standard defines a paper speed point, H_M, as the exposure giving 0.60 above base-plus-fog, reported on a P-scale; that governs how long you expose, not contrast, and matters later.
The standard’s own justification is the rule the whole craft rests on. Its introduction states that highly acceptable prints are generally obtained when the log exposure range of the paper equals the effective density range of the negative. Matching is not a rule of thumb dressed up in numbers; it is the finding the standard was written around.
Manufacturers measure R under controlled conditions and print it. Ilford’s HARMAN technical sheet for MULTIGRADE RC papers (revision 060619) lists the ISO range for MULTIGRADE IV RC DELUXE across its variable-contrast filter set as 180 at filter 00, 160 at 0, 130 at 1, 110 at 2, 90 at 3, 60 at 4 and 40 at 5, with the unfiltered paper at 110. Lower filter numbers give a longer scale and softer contrast; higher numbers a shorter scale and harder contrast.
The relationship is not peculiar to one emulsion. The same datasheet gives MULTIGRADE RC WARMTONE as 190, 160, 130, 110, 90, 70 and 50 across 00 to 5 — the same descending shape, shifted at the hard end. For orientation against graded papers, Roger Hicks’s grade-to-range bands map grade 5 to R 35–50 (very hard), 4 to 50–70, 3 to 70–90 (hard normal), 2 to 90–110 (soft normal), 1 to 110–130, 0 to 130–160 and 00 to 160 and above. That places grade 2 — Ilford’s filter-2 figure of 110, sitting inside Hicks’s 90–110 band — squarely in the centre of the scale, which is why it is treated as the standard starting point.
One caveat on those figures: ISO range is determined with a tungsten source at 3000 K. Ilford notes the papers also suit LED and some cold-cathode variable-contrast heads, but warns that other cold-cathode (cold light) and pulsed-xenon sources may give a reduced contrast range. A cold-light printer reading the published table can be a grade adrift before measuring anything.
The matching figure on the negative side is its density range, the difference in optical density between the shadow and highlight values that matter. Adams, in The Negative, ties it to development: exposure sets the shadow densities, while development largely fixes how far the highlights rise above them. But the figure that matters is the effective density range projected at the baseboard, not the raw number off a transmission densitometer — and ISO 6846 introduces the term precisely because the two diverge whenever the enlarger uses anything other than fully diffuse optics.
The mechanism is the Callier effect. A condenser head projects a collimated, near-specular beam; dense, grainy highlight areas scatter that beam out of the lens far more than thin shadow areas do, so highlights print proportionally darker and the projected contrast climbs. The Callier Q factor — the ratio of specular to diffuse density — is always at least 1 and rises with grain density, so it bites hardest in the dense highlight region of a normal negative. The practical consequence is blunt: a diffuse densitometer reading under-states the printing range on a condenser enlarger, and the same negative can print one to two grades harder on a condenser than on a diffuser. (Dye-based colour materials barely scatter, so Q is roughly 1 and head type is a non-issue there; this is a silver black-and-white problem only.) The honest move is to measure the projected range at the baseboard with an enlarging photometer, or to correct the densitometer reading for your head, rather than trust the contact-printing number.
This also reframes the “normal” negative. Zone System normal-development targets are enlarger-dependent: for a diffusion enlarger, Zone VIII net density is aimed around 1.25 to 1.35 (a net density range near 1.15 to 1.25), whereas for a condenser the Zone VIII target drops to about 1.15 to 1.25 to compensate for the contrast the optics add. A diffusion-developed negative aiming at the upper figures lands near a grade-2 fit; quoting a single LER like “1.05 to 1.10” without naming the enlarger is the kind of half-truth this section exists to correct.
The procedure follows from the two scales: multiply the effective density range by 100 and find the nearest published ISO range. Ilford’s own worked example (same datasheet) takes a negative measured at an effective density range of 1.32 log exposure units — 1.32 × 100 = 132, nearest to R 130, which on MULTIGRADE IV RC is filter 1.
Working the other two cases with real arithmetic shows the inverse relationship in action. A thin, underdeveloped negative measured at a density range of 0.90 gives 0.90 × 100 = 90, nearest to R 90 — filter 3. The short negative range needs the paper’s short scale, harder contrast, to stretch its few tones across the full distance from white to black; on grade 2 it would read flat and grey. A contrasty negative measured at 1.60 gives 160, nearest to R 160 — filter 0. Its long range needs the paper’s long scale, softer contrast, or the shadows block and the highlights chalk out.
The filter set runs 00 to 5 in half-grade steps — twelve filters in all — and that granularity is the reason to keep the arithmetic. When a computed figure falls between two table values, say 100 (between R 90 and R 110), you split the difference with a half grade rather than rounding to the nearer whole one.
The ISO range tells you which filter; the ISO speed point tells you what it costs in exposure. On MULTIGRADE IV RC, filters 00 through 3.5 carry a paper speed of P200, while filters 4 and 5 drop to P100 (the unfiltered paper is P500). Halving the speed is why a print made on filter 4 or 5 needs roughly double the exposure time of one on the softer filters at the same aperture and height — not a quirk of any one enlarger but a property printed in the speed table. Reach for a hard grade to tame a thin negative and you should expect the timer to roughly double; budget for it rather than chase a fault that is not there.
The two figures together close the loop: range chooses the contrast, speed sets the clock. Match the effective density range of the negative to the paper’s ISO range, correct for your head, and the print carries detail from the first tone above white to the last tone short of solid black — which is the whole point of measuring instead of guessing.
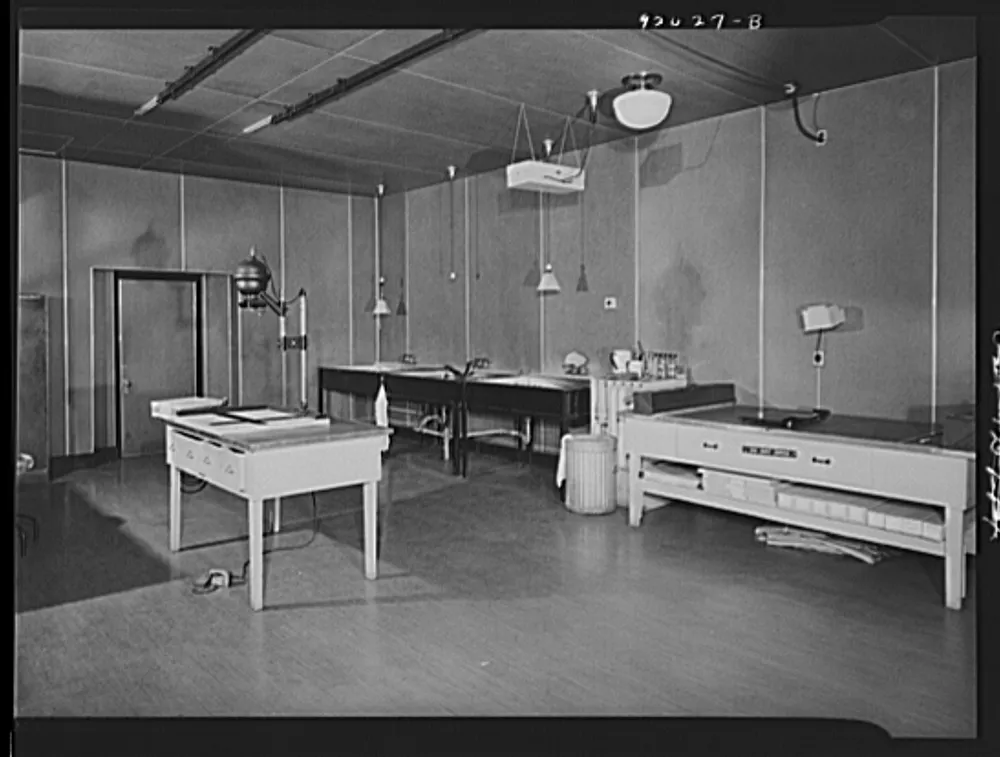
Image: U.S. Farm Security Administration / Office of War Information, Enlarging room with a Leitz miniature enlarger and developing sinks, photograph laboratory in the Auditor’s Building, Washington, D.C. (1941), U.S. Library of Congress, no known restrictions
· 6 min read
How the baryta-and-paper construction of fibre prints differs from the plastic-sealed RC base, and the consequences for washing, drying and archival life.
· 6 min read
How fixed-grade and variable-contrast darkroom papers control tonal contrast, and the trade-offs in consistency, flexibility and split-grade printing.
· 7 min read
How to choose safelight colour, wattage and distance for black and white paper, and run a fog test that reveals trouble before it shows.
The grainmag companion app
Meter and place your tones without a signal. No account, no internet required — just you, the light, and the grain.